The original document is available as a vignette in the epiworldR package. This version is adapted for the InsightNet 2026 course and may contain edits for clarity or relevance to the course content.
Introduction
The model_builder functions in epiworldR let you assemble a model one piece at a time. Instead of starting from a predefined model such as ModelSIR() or ModelSEIRD(), you begin with an empty model and add the ingredients yourself. This is useful when you want to understand how a model is constructed or when you need a compartment structure that is not already available in the package.
There are four moving parts:
Parameters, which store values such as transmission or recovery rates.
States, which define the compartments of the model.
Update functions, which tell agents what can happen while they are in a given state.
Viruses, which connect the infection process to the model states.
One important detail is that states are indexed in the order they are added, starting at 0. We will use those indices when defining transitions.
A minimal model built from scratch
We begin with a simple three-state model: susceptible, infected, and recovered. The goal here is to make the model builder workflow explicit before moving to a slightly richer example.
library(epiworldR)
Thank you for using epiworldR! Please consider citing it in your work.
You can find the citation information by running
  citation("epiworldR")
At this point the model has parameters, but no states. Next we create the update functions. Susceptible agents use update_fun_susceptible(), which evaluates infection from their contacts. Infected agents use update_fun_rate(), which moves them to another state according to a daily transition probability.
Now we add the states. Because states are indexed from 0, the order matters (we can use the |> operator to make it clear which state gets which index):
  index       state
1     0 Susceptible
2     1    Infected
3     2   Recovered
The infected state points to 2L, meaning that infected agents move to the third state added to the model, "Recovered". The "Recovered" state has no update function, so agents who enter that state remain there until the end of the simulation.
The last piece is the virus. Here we define how the virus maps to the model states:
newly infected agents move to state 1L ("Infected"),
agents who recover end in state 2L ("Recovered"),
and agents removed from the virus also end in state 2L.
flu <-virus(name ="Flu",prevalence =0.01,as_proportion =TRUE,prob_infecting =0.01,recovery_rate =1/7) |># Associating the virus with the model statesvirus_set_state(init =1L, end =2L, removed =2L) |># Linking the virus rate to a model parameterset_prob_infecting_ptr(sir_builder, "Transmission rate") |># Setting the distribution (random to 1% of the agents)set_distribution_virus(distribute_virus_randomly(0.01, TRUE))add_virus(sir_builder, flu)
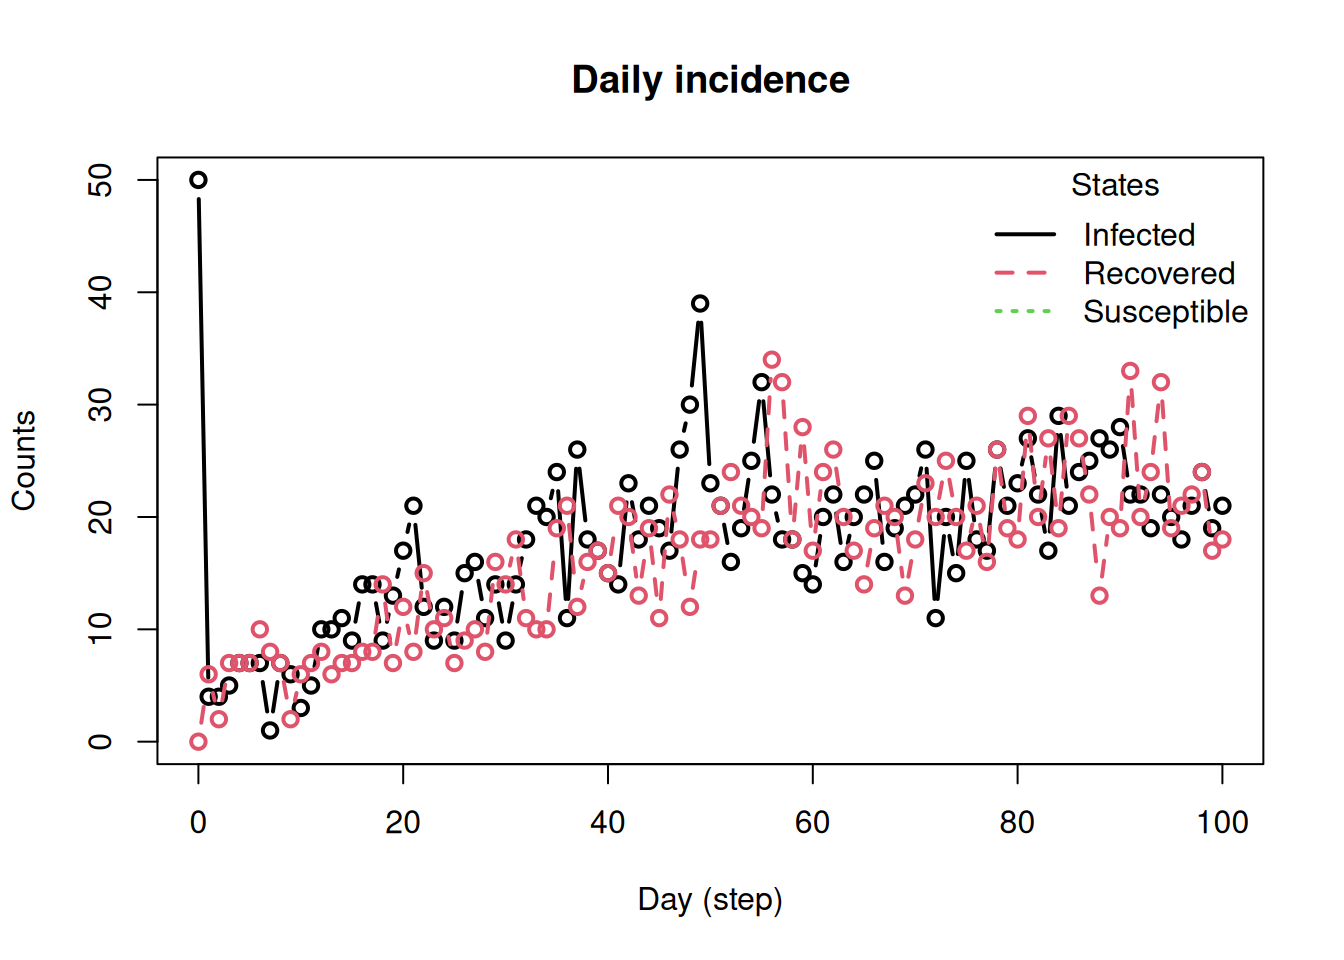
With states and virus in place, we still need a population. The following code creates a small-world network, runs the simulation, and shows the result:
agents_smallworld(sir_builder, n =5000, k =10, d =FALSE, p =0.01)verbose_off(sir_builder)run(sir_builder, ndays =100, seed =1912)summary(sir_builder)
________________________________________________________________________________
________________________________________________________________________________
SIMULATION STUDY

Name of the model   : (none)
Population size     : 5000
Agents' data        : (none)
Number of entities  : 0
Days (duration)     : 100 (of 100)
Number of viruses   : 1
Last run elapsed t  : 19.00ms
Last run speed      : 26.16 million agents x day / second
Rewiring            : off
Last seed used      : 1912

Global events:
 (none)

Virus(es):
 - Flu

Tool(s):
 (none)

Model parameters:
 - Recovery rate     : 0.1429
 - Transmission rate : 0.0100

Distribution of the population at time 100:
  - (0) Susceptible : 4950 -> 3186
  - (1) Infected    :   50 -> 153
  - (2) Recovered   :    0 -> 1661

Transition Probabilities:
 - Susceptible  1.00  0.00     -
 - Infected        -  0.86  0.14
 - Recovered       -     -  1.00
plot_incidence(sir_builder)
We can even create a plot of the model structure using draw_mermaid():
This is the full model builder pattern in its simplest form: create an empty model, add parameters, add states with their update rules, attach a virus, add a population, and run.
Extending the model to SEIRD
We can now use the same pattern to build a model with five states:
Susceptible
Exposed
Infected
Recovered
Deceased
The main new feature is that infected agents can transition to more than one state. In this example, they can recover or die.
The exposed state has one possible transition, from exposed to infected. The infected state has two possible transitions, one to recovery and one to death. These are specified by passing a vector of parameter names and a matching vector of target states. Since this model has an incubation period (Exposed state), we also need to exclude the exposed and recovered states from the susceptible update function. The exclusion only applies to agents carrying the virus:
# We exclude exposed from the samplingupdate_s <-update_fun_susceptible(exclude =c(3L, 4L))update_e <-update_fun_rate(param_names ="Incubation rate",target_states =2L)update_i <-update_fun_rate(param_names =c("Recovery rate", "Death rate"),target_states =c(3L, 4L))
  index       state
1     0 Susceptible
2     1     Exposed
3     2    Infected
4     3   Recovered
5     4    Deceased
As before, the order is what determines the state indices. In particular:
1L is "Exposed",
3L is "Recovered",
4L is "Deceased".
Those indices are used when defining the virus. Newly infected agents enter the exposed state, recovered agents end in the recovered state, and agents removed through death end in the deceased state.
virus(name ="COVID-19",prevalence =0.01,as_proportion =TRUE,prob_infecting =0.01,recovery_rate =1/7,prob_death =0.01) |>virus_set_state(init =1L, end =3L, removed =4L) |>set_prob_infecting_ptr(seird_builder, "Transmission rate") |>set_distribution_virus(distribute_virus_randomly(0.01, TRUE)) |># Notice we can also use the pipe here!add_virus(model = seird_builder)
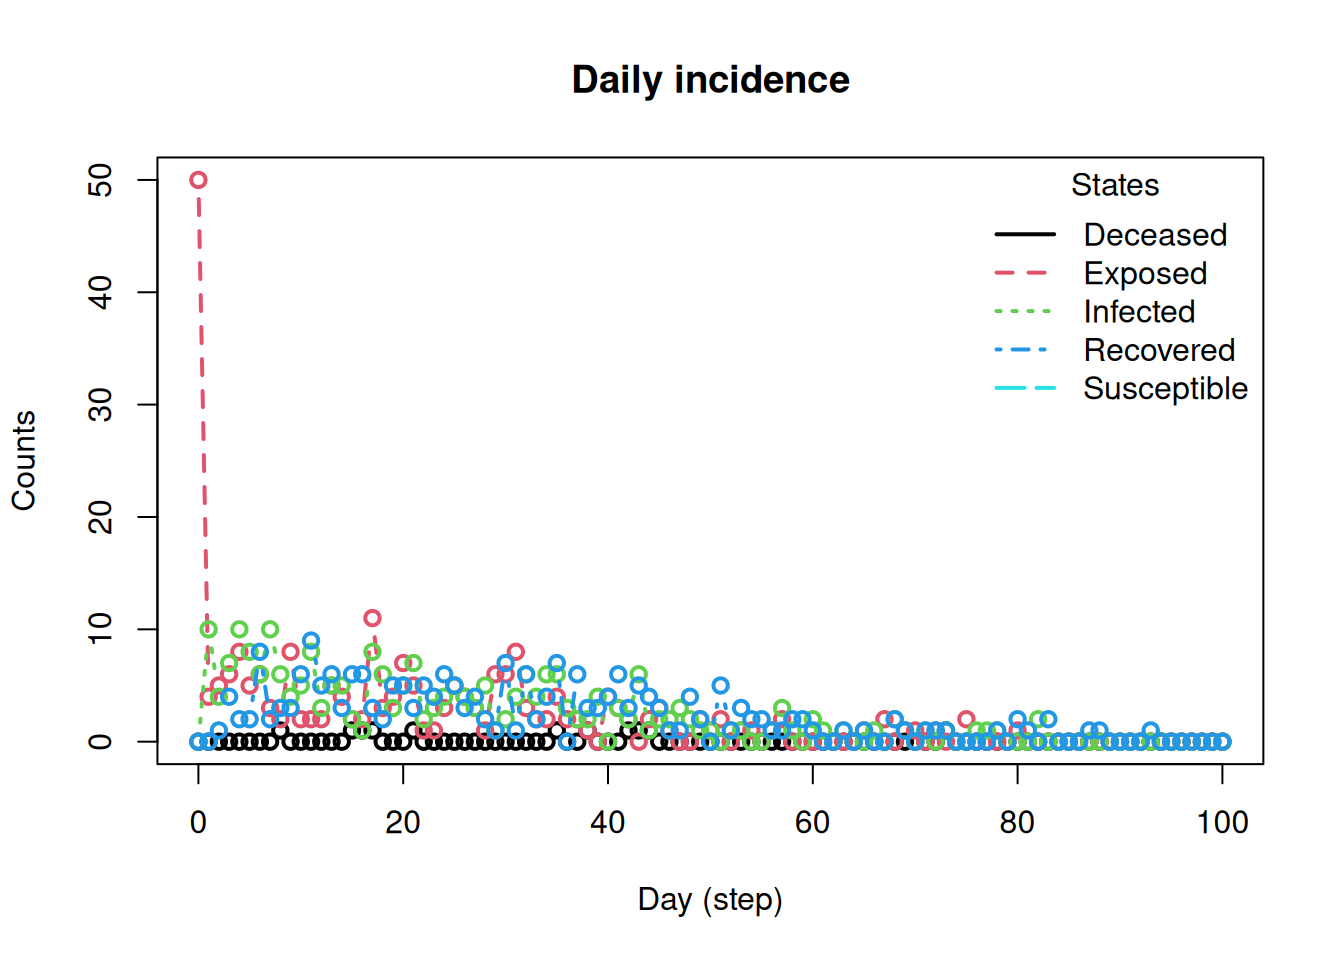
The remainder is the same as before: define the population, run the model, and inspect the output.
agents_smallworld(seird_builder, n =5000, k =10, d =FALSE, p =0.01)verbose_off(seird_builder)run(seird_builder, ndays =100, seed =1912)summary(seird_builder)
________________________________________________________________________________
________________________________________________________________________________
SIMULATION STUDY

Name of the model   : (none)
Population size     : 5000
Agents' data        : (none)
Number of entities  : 0
Days (duration)     : 100 (of 100)
Number of viruses   : 1
Last run elapsed t  : 6.00ms
Last run speed      : 77.65 million agents x day / second
Rewiring            : off
Last seed used      : 1912

Global events:
 (none)

Virus(es):
 - COVID-19

Tool(s):
 (none)

Model parameters:
 - Death rate        : 0.0100
 - Incubation rate   : 0.2000
 - Recovery rate     : 0.1429
 - Transmission rate : 0.0100

Distribution of the population at time 100:
  - (0) Susceptible : 4950 -> 4766
  - (1) Exposed     :   50 -> 0
  - (2) Infected    :    0 -> 0
  - (3) Recovered   :    0 -> 223
  - (4) Deceased    :    0 -> 11

Transition Probabilities:
 - Susceptible  1.00  0.00     -     -     -
 - Exposed         -  0.81  0.19     -     -
 - Infected        -     -  0.85  0.14  0.01
 - Recovered       -     -     -  1.00     -
 - Deceased        -     -     -     -  1.00
That single object encodes two possible exits from infection. Once that pattern is clear, building other compartment models becomes much easier: add the states you need, then give each state an update rule that matches the transitions you want to allow.
A note about calibration
Calibrating ABMs is not straightforward, especially in the case of network-based models (see for instance Huang et al. (2025)). Nonetheless, we can still have a nice starting point anchored in theory. One way to approach this is using the basic reproductive number ; based on how we parametrize models in epiworld, we can write:
Where is the contact rate, is the transmission probability, and is the recovery probability. So, in the case of our last model, we could say the following: given the transmission rate is 0.01 and recovery is 1/7, if we use an , then the contact rate should be:
which, in our network based model, means setting the mean degree to be approximately 28.57. As a practical recommendation, I would suggest the user to set a higher contact/degree rate and modify the transmission rate if possible (which would require re-arranging the equation); otherwise, as the contact rate reduces, the local competition and local depletion of susceptibles effects described in Huang et al. (2025) become apparent. As the contact rate increases, both mixing and network-based models start behaving as compartmental models, which may be desirable in many cases.
References
Huang, Peng, Zack W. Almquist, and Carter T. Butts. 2025. “Endogenous Competition and the Underrealized Reproduction of Infectious Diseases.”Proceedings of the National Academy of Sciences 122 (23): e2502676122. https://doi.org/10.1073/pnas.2502676122.