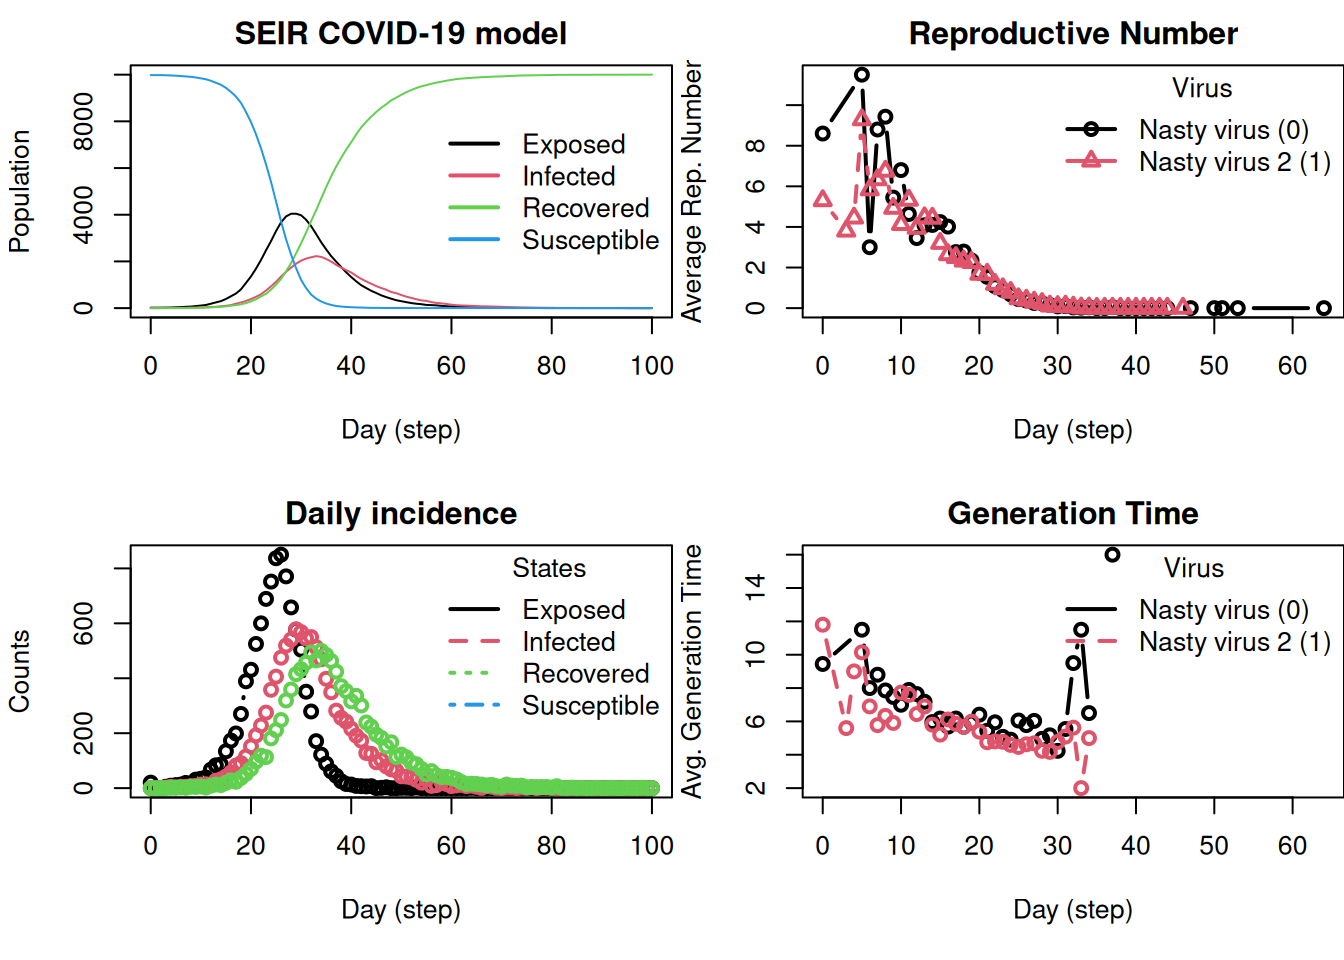
library(epiworldR)# Create a modelmymodel <-ModelSEIRCONN(name ="Nasty virus", n =10000, prevalence = .001, contact_rate =4,transmission_rate = .4, incubation_days =7, recovery_rate =1/7) |>verbose_off() # Add a second virusadd_virus( mymodel, virus(name ="Nasty virus 2",prob_infecting = .5,recovery_rate = .3, ), proportion = .001)# Rename the modelset_name(mymodel, mname ="SEIR COVID-19 model")# Run the modelset.seed(8383)run(mymodel, ndays =100)# Plot the model# - Set graphical parameters to plot in 2x2 gridop <-par(mfrow =c(2, 2), mar =par()$mar *c(1, 1, 1/2, 0))# - Plotplot(mymodel)plot_reproductive_number(mymodel)plot_incidence(mymodel)plot_generation_time(mymodel)# - Restore original graphical parameterspar(op)
Figure 1
Welcome to the InsightNet 2026 workshop Simulating Complex Agent-Based Models with {epiworldR}.
The {epiworldR} R package is a wrapper of the C++ library epiworld. It provides a fast, highly customizable framework for building network-based transmission/diffusion agent-based models (ABM).
Key features of {epiworldR} include:
Fast simulation with an average of 30 million agents/model-step/second
User-defined interventions (events, tools, policies, etc.) that change model behavior while it is running
Adapting transmission and recovery rates based on comorbidities
Parallel computing out-of-the-box
Likelihood-free Markov chain Monte Carlo (LFMCMC)
Models with an arbitrary number of compartments/states beyond SIR/SEIR.
Additionally, while {epiworldR} was built for models of disease transmission, the {epiworld} framework is general enough to build models for many diffusion processes beyond infectious disease.
Requirements
You can install the required packages for the session using the following code:
# The measles and epiworldR packagesinstall.packages(c('epiworldR', 'measles'),repos =c('https://uofuepibio.r-universe.dev','https://cloud.r-project.org'))# Additional packagesinstall.packages(c("data.table", "ggplot2", "DiagrammeR", "netplot", "igraph"))