[31m
processing file: methodology.qmd
[39m1/23
2/23 [load-forecast-script]
3/23
4/23 [plot-observed-data]
[31mtrying URL 'https://coronavirus-dashboard.utah.gov/Utah_COVID19_data.zip'
[39m[31mContent type 'application/zip' length 724923 bytes (707 KB)
===[39m[31m=[39m[31m=[39m[31m=[39m[31m=[39m[31m=[39m[31m=[39m[31m==[39m[31m=[39m[31m=[39m[31m=[39m[31m==[39m[31m=[39m[31m=[39m[31m==[39m[31m=[39m[31m=[39m[31m=[39m[31m=[39m[31m=[39m[31m==[39m[31m=[39m[31m==[39m[31m=[39m[31m==[39m[31m===[39m[31m==[39m[31m==[39m[31m==[39m[31m===[39m[31m==[39m[31m==[39m[31m=
downloaded 707 KB
[39m5/23
6/23 [model-definition]
7/23
8/23 [unnamed-chunk-4]
9/23
10/23 [run-lfmcmc]
11/23
12/23 [print-lfmcmc-results]
13/23
14/23 [lfmcmc-trace-plot]
15/23
16/23 [plot-posterior-dist]
17/23
18/23 [run-forecast]
19/23
20/23 [plot-forecast]
21/23
22/23 [saving]
23/23
[31moutput file: methodology.knit.md
[39m[1mpandoc [22m
to: html
output-file: methodology.html
standalone: true
title-prefix: Epiworld Forecasts
section-divs: true
html-math-method: mathjax
wrap: none
default-image-extension: png
css:
- styles.css
toc: true
[1mmetadata[22m
document-css: false
link-citations: true
date-format: long
lang: en
theme: cosmo
title: Methodology
date: last-modified
Output created: build/html/methodology.html14-Day COVID-19 Forecast for Utah
Introduction
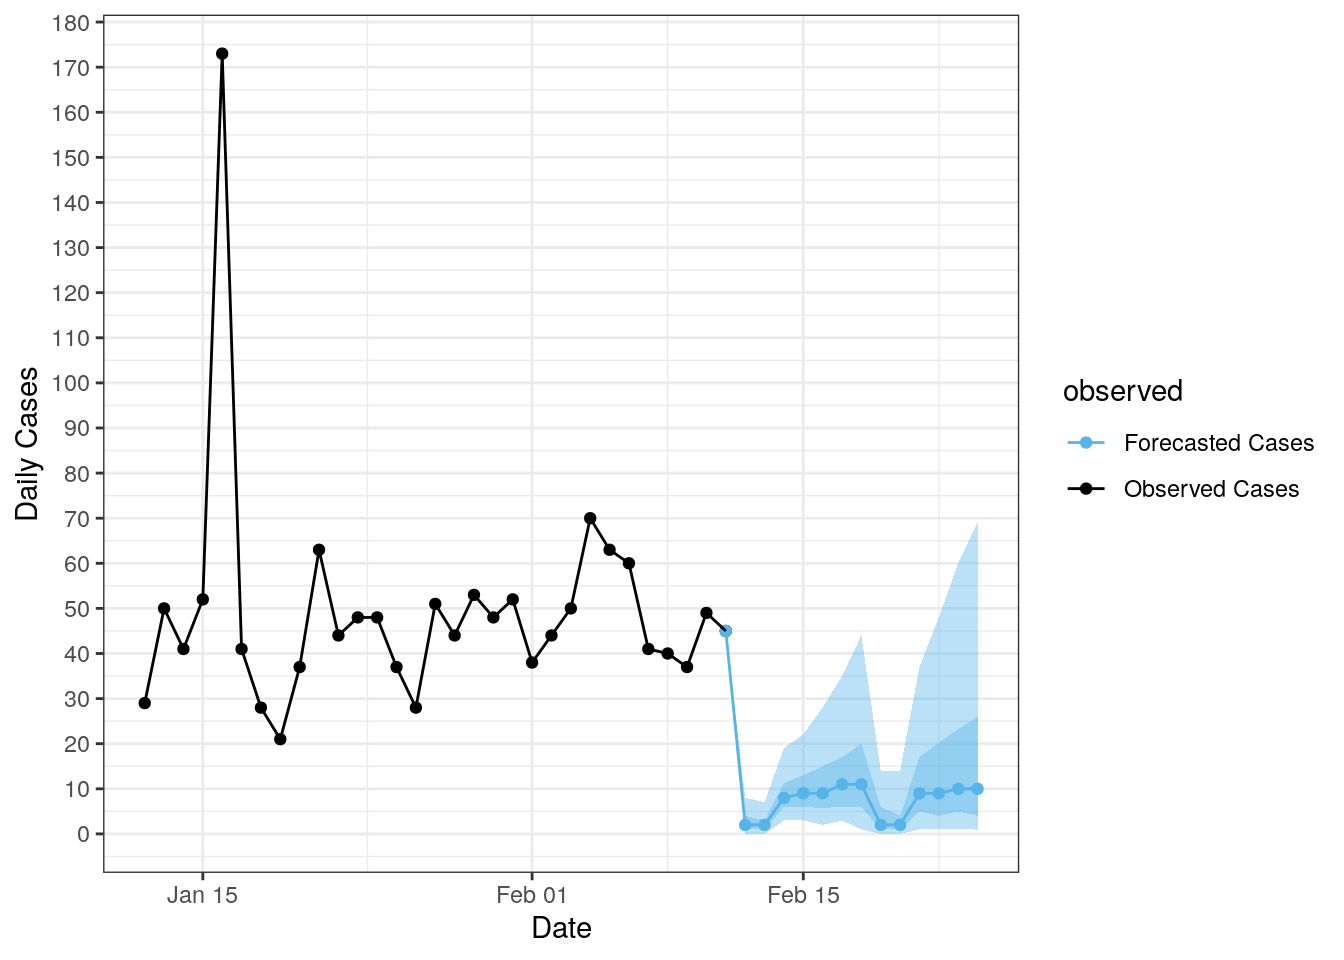
Using case count data published by the Utah DHHS and the epiworldR package, we calibrate and run an SIR connected model to generate a COVID-19 forecast for Utah. The 14-day forecast updates automatically each week.
COVID-19 Forecast
Here is the forecast mean along with the 50% and 95% confidence intervals. The actual case counts are plotted in black, while the forecast is plotted in blue.
Acknowledgements
This forecast was developed jointly by Andrew Pulsipher and George Vega Yon as part of the EpiForeSITE project.