Plot a summrt_summary object
autoplot.summrt_summary.RdPlot a summrt_summary object
# S3 method for class 'summrt_summary'
autoplot(object, color = "dodgerblue4", add_reference_line = TRUE, ...)
Arguments
Value
A ggplot2::ggplot() object.
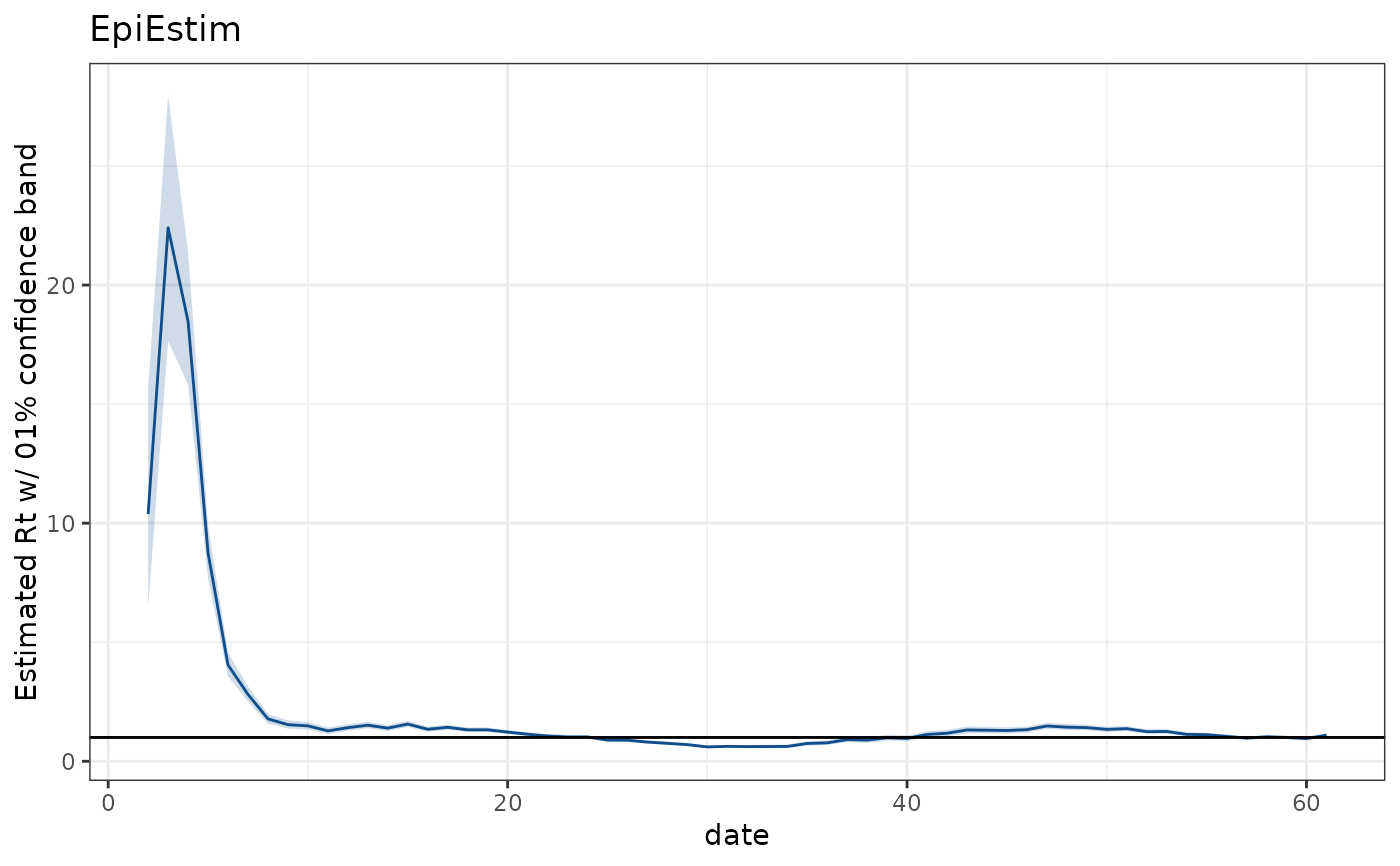
Examples
ex <- readRDS(system.file(
"extdata", "EpiEstim_example.rds", package = "summrt"
))
summ_ex <- summarize_rtestimate(ex)
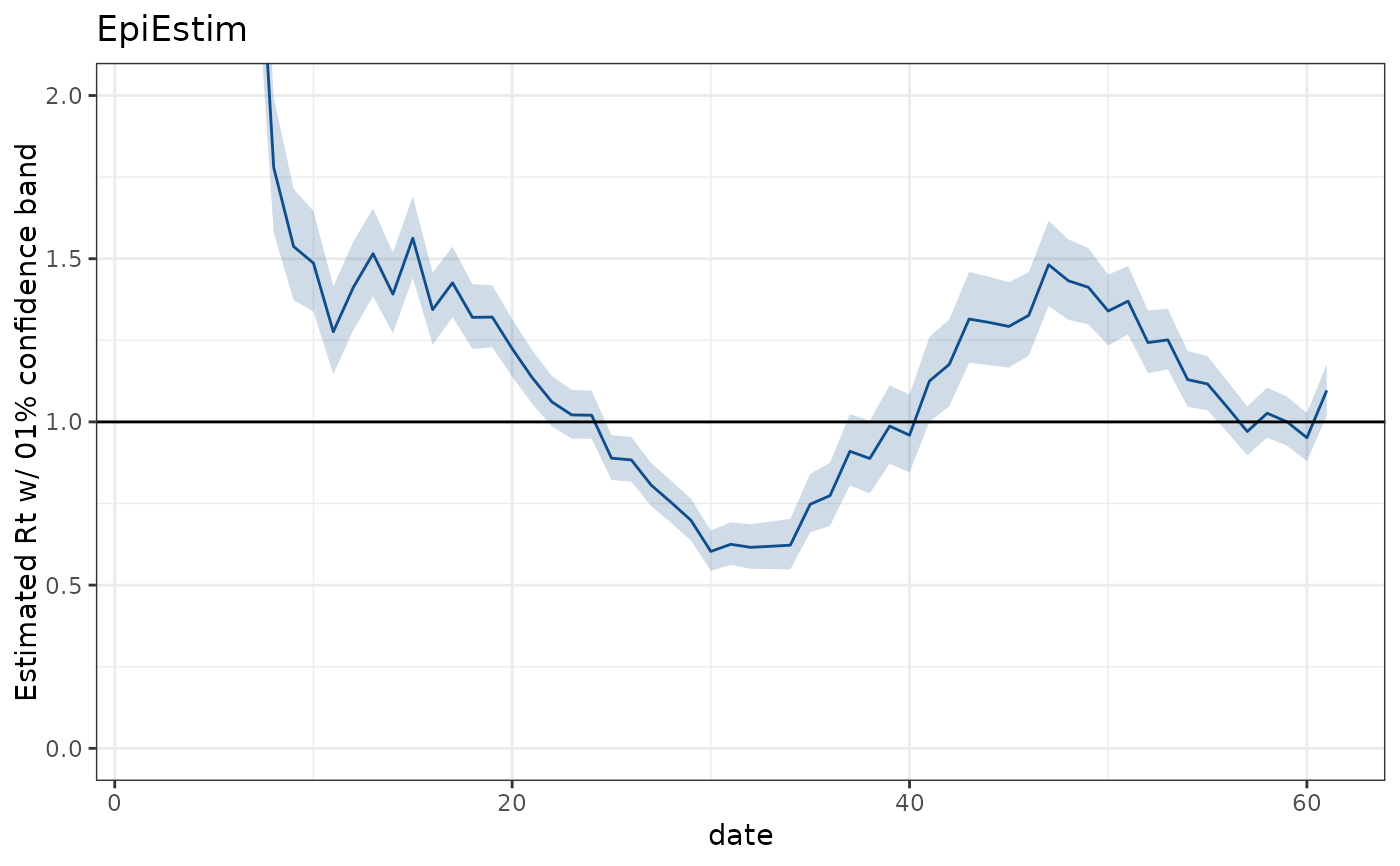
autoplot(summ_ex)
 autoplot(summ_ex) + ggplot2::coord_cartesian(ylim = c(0, 2))